loryR Quick and Easy
Kent Russell
2015-05-14
loryR offers the fine dependency-free slider lory.js from Maximilian Heinz as a htmlwidget. R users can employ a slider (or embedded slideshow/gallery) like this in many ways. Let’s look at two different uses to help us explore how we might work with loryR.
Quick Install
devtools::install_github( "timelyportfolio/loryR" )Use 1 | RStudio Gallery
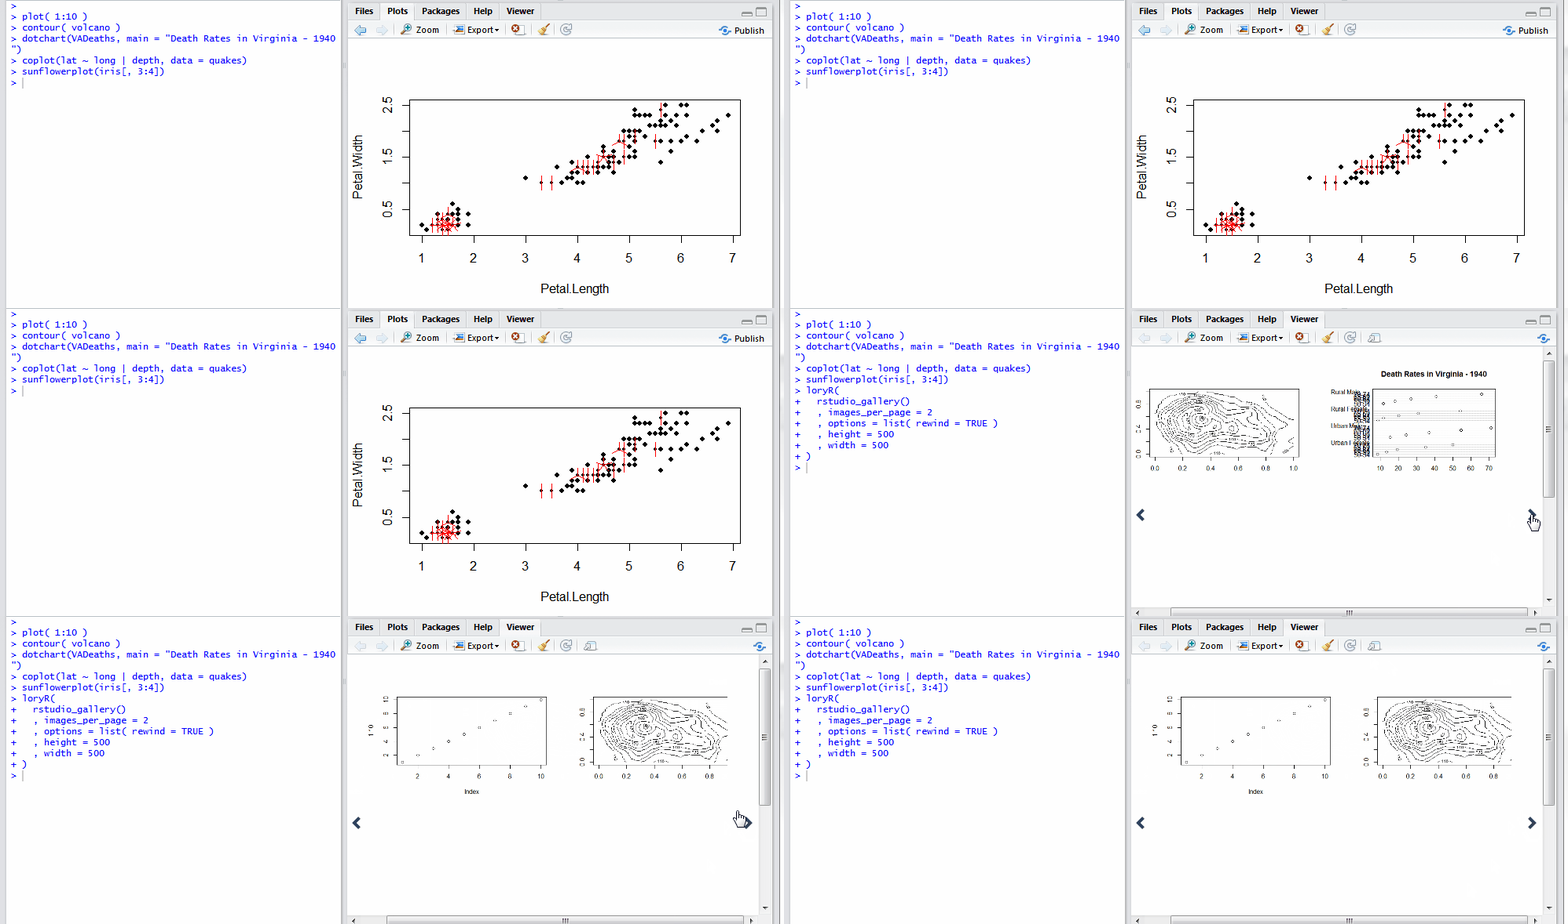
As we bang away in RStudio, we can unintentionally collect quite a few plots in our Plots tab. I often want to quickly view or share some or all of these plots. The function rstudio_gallery() in loryR solves this problem.
##### run these one at a time
#####   to make some fake sample plots
plot( 1:10 )
contour( volcano )
dotchart(VADeaths, main = "Death Rates in Virginia - 1940")
coplot(lat ~ long | depth, data = quakes)
sunflowerplot(iris[, 3:4])
Now let’s create our loryR gallery of our wonderful creations.
library(loryR)

loryR(
  rstudio_gallery()
  , images_per_page = 2
  , options = list( rewind = TRUE )
  , height = 500
  , width = 500
)
I wish I was able to get the slider to appear right here, but I haven’t found out yet how to when knitting a vignette. Please try it though on your machine. I think you will like the result.
Use 2 | In a Vignette
Often in a package documentation context, a nice summary view might entice the reader to more thoroughly explore your package. Let’s pretend we our making a vignette for the really neat package tmap from Martijn Tennekes. Here is one way to make a nice summary slider with the tmaps to include at the top of the vignette. Please note all the tmap code comes from the tmap vignette, so all credit goes there.
library(tmap)
library(loryR)
library(pipeR)  ## feel free to use magrittr if you prefer

### all of the tmap examples are from the tmap vignette
###  https://github.com/mtennekes/tmap/blob/master/pkg/vignettes/tmap-nutshell.Rmd
data(Europe)

list(
  quote(qtm(Europe))
  ,quote({
    qtm(Europe, fill="gdp_cap_est", text="iso_a3", text.size="AREA",
        root=5, fill.title="GDP per capita",
        fill.textNA="Non-European countries", theme="Europe")
  })
  ,quote({
    data(rivers)
    data(metro)

    tm_shape(Europe) +
        tm_fill("pop_est_dens", style="kmeans", textNA="Non-European countries"
                , title="Country population density (per km2)") +
        tm_borders() +
        tm_shape(rivers) +
        tm_lines("dodgerblue3") +
        tm_shape(metro) +
        tm_text("name", size="X2010", scale=1, ymod=-.02, root=4, size.lowerbound = .60,
                bg.color="yellow", bg.alpha = .5) +
        tm_bubbles("X2010", "red", border.col = "black", border.lwd=1
                   , size.lim = c(0, 11e6), sizes.legend = seq(2e6,10e6, by=2e6)
                   , title.size="City Population") +
    tm_shape(Europe) +
        tm_text("iso_a3", size="area", scale=1.5, root=8, size.lowerbound = .40,
                fontface="bold", case=NA, fontcolor = "gray35") +
    tm_layout_Europe("Map of Europe", legend.width=.6)
  })
  ,quote({
    tm_shape(Europe) +
      tm_fill("gdp_cap_est", style="kmeans", title="GDP per capita") +
      tm_facets("part") +
      tm_layout_Europe()
  })
  ,quote({
    data(World)

    rivers$constant <- factor("Rivers")
    tm_shape(World) +
        tm_fill() +
    tm_shape(rivers) +
        tm_lines(col="constant", palette="dodgerblue3", title.col="World map") +
        tm_layout_World()
  })
) %>>%
  lapply(
    function(plot_expr){
      tf <- tempfile()
      png(tf, width = 600, height = 500, units = "px")
        print(eval(plot_expr))
      dev.off()
      base64enc::dataURI(file=tf, mime="image/png")
    }
  ) %>>%
  loryR( images_per_page = 1, options = list(rewind=TRUE), height = 600, width = 650 )
Thanks
Thanks so much
lory.jsfrom Maximilian Heinz- Ramnath Vaidyanathan and RStudio for
htmlwidgets - all the contributors to
RandJavaScript